Is it the taking part that counts? BBF 2012 review – Part 2
Last year I ran some numbers on the 2011 season to see if the best teams were really the best teams. Well, sort of. In my infinite wisdom, and with the idea that surely playing the game is winning itself, and therefore should be recognised, I calculated win percentage and games-played percentage (as a substantial number of teams did not complete a full season) to arrive at what was widely heralded to be a waste of time!
However, in 2011 we saw that teams who completed all their games, as well as being most successful on the field, deserved a slightly higher acknowledgement of their effort; time and again we’ve been told that getting a team out is a success in this sport, so I figured that we’d tip our caps to those that did.
The findings weren’t amazing, although it did mean that a couple of sides should perhaps have been better placed by the end of the year. The Essex Redbacks were denied a shot at top spot in AAA South in 2011 because other teams failed to fulfil fixtures, thus not dropping their win ratio, while the Lakenheath Diamondbacks in the NBL were deemed to have placed two spots higher than they should have in compiling the best winning percentage, because they also forfeited two games and failed to play one of their 28 scheduled matches.
There were far fewer shake-ups in the 2012 standings, especially among the leaders, with the Liverpool Trojans, Hove Tuesday, Nottingham Rebels and Guildford Mavericks each scoring over 1.8 in the adjusted tables (maximum 1 for going unbeaten + maximum 1 for completing all fixtures). The Trojans, Rebels and Mavericks had been there or thereabouts in 2011, although the Mavericks’ failure to complete 9% of their fixtures had dropped them two places, but still no team in the past two years has hit the magic 2 – having played all their scheduled games and won the whole lot – during the regular season. We’ll call this statistic the ‘CP number’, where competitiveness and participation are combined.
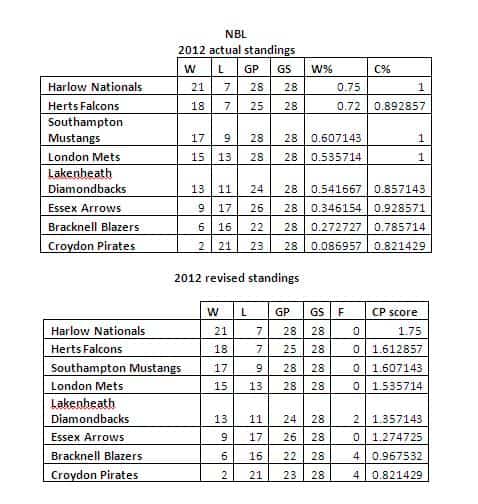
NBL – Harlow improve regular season run-in, Herts make giant jump
Yes, the Southern Nationals renaming to represent their home town of Harlow was a terrific success, but what was more important was increasing their winning percentage from their 2011 campaign. One-game heroes in their debut season, doing enough to qualify for the postseason and then blast their opposition out of the water en route to the Championship, 2012 saw them win three quarters of their games, and again play every one on the fixture card, earning them an outright first in the regular season.
Everyone else finished the season where they ended in the revised standings, with Herts Falcons taking second after a terrible 2011 season, Southampton Mustangs third and London Mets fourth, as it was by the end of the NBCs.
Towards the bottom of the table, teams’ abilities to complete their season waned as the weather took hold, and the Bracknell Blazers were the worst of the bunch with less than 80% of their fixtures completed. Bracknell’s six wins, however, were enough to keep the Croydon Pirates bottom of the pile.
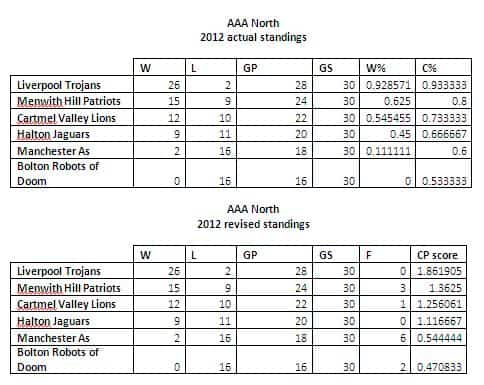
AAA North – Trojans charge and Robots malfunction
After an excellent 2011 campaign, the Bolton Robots of Doom were rightly elevated to the region’s top division (their 1.78 combined total was good enough for fourth across the country), but announced their promotion with a winless season and two forfeits, completing only 16 of 30 games. Nightmare. The whole division was badly affected, though, and only the Liverpool Trojans played more than 80% of their schedule. And unsurprisingly they won most of them too, for a combined 1.86 – one of the best in Britain.
As with the NBL, the final table in the revised standings is identical to the official one.
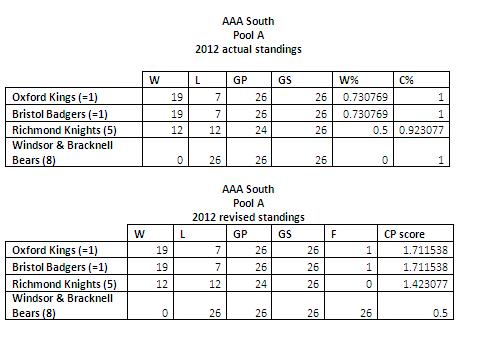
AAA South – forfeits boost winning percentages, undermine quality of division
AAA South was one of the most competitive leagues in 2012, on the field at least, but the inflated numbers of both Bristol Badgers and Oxford Kings, and the Richmond Knights who finished third in their pool and fifth overall, could be attributed to one thing – Windsor & Bracknell pulling out after the start of the season, giving them easy walkover wins, when the two Pools were already weighted for more internal play.
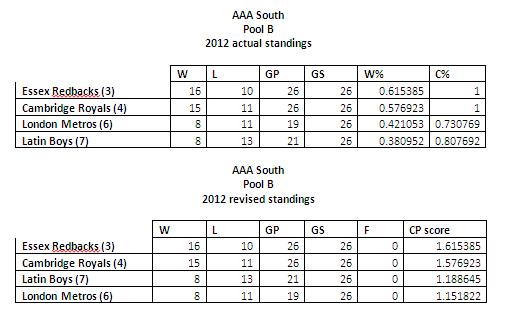
Not to deny Oxford, Richmond or Bristol, who each could have swept the Bears anyway as had been proved in previous seasons, but the weighted schedule meant that they were boosted up both the official and revised table by virtue of walkovers, which are also completed fixtures. Winning was harder for teams in Pool B, with the Essex Redbacks, Cambridge Royals, Latin Boys and London Metros beating each other up consistently.
Again, the teams that finished lowest also didn’t finish their entire season (Windsor aside, whose 26 forfeits meant that at least they recorded a result for every scheduled match, despite a genuine win on the opening day!)